By Ben Kraft
Last year, William wrote about how we optimized our in-memory content data to take up less space. But this was always a temporary solution: if we want to have a separate content tree for each language, we knew we would need to break up the monolithic content blob, and pull in content on-demand.
In principle, doing this is simple — we already use App Engine’s Memcached, so all we need to do is change our data structures to pull in content from there whenever someone asks for it. But that might be some unknown amount slower — many requests access dozens or even hundreds of content items, which right now is plenty fast! We had several ideas for how to improve access patterns and speed things up, but we didn’t want to spend a couple months building one only to find it wasn’t fast enough. We had some vague guesses as to how often we access content, what requests would be the worst, and how fast Memcached is, but we didn’t really know. So last fall we set out to find out.
Measuring Memcached latency
First we just wanted to answer a simple question: how fast is a Memcached access on App Engine? Despite our heavy use of Memcached, we didn’t really have a good estimate! So we wrote a simple API endpoint to profile a Memcached get:
@app.route('...')
@developer_required
def profile_memcached():
    num_bytes = int(request.args.get(num_bytes))
    data = os.urandom(num_bytes)
    key = 'profile_memcache_%s' % base64.b64encode(os.urandom(16))
    success = memcache.set(key, data)
    if not success:
        raise RuntimeError('Memcached set failed!')

    get_start = time.time()
    data_again = memcache.get(key)
    get_end = time.time()

    memcache.delete(key)
    return flask.jsonify(
        time=get_end - get_start,
        correct=data == data_again,
        key=key)
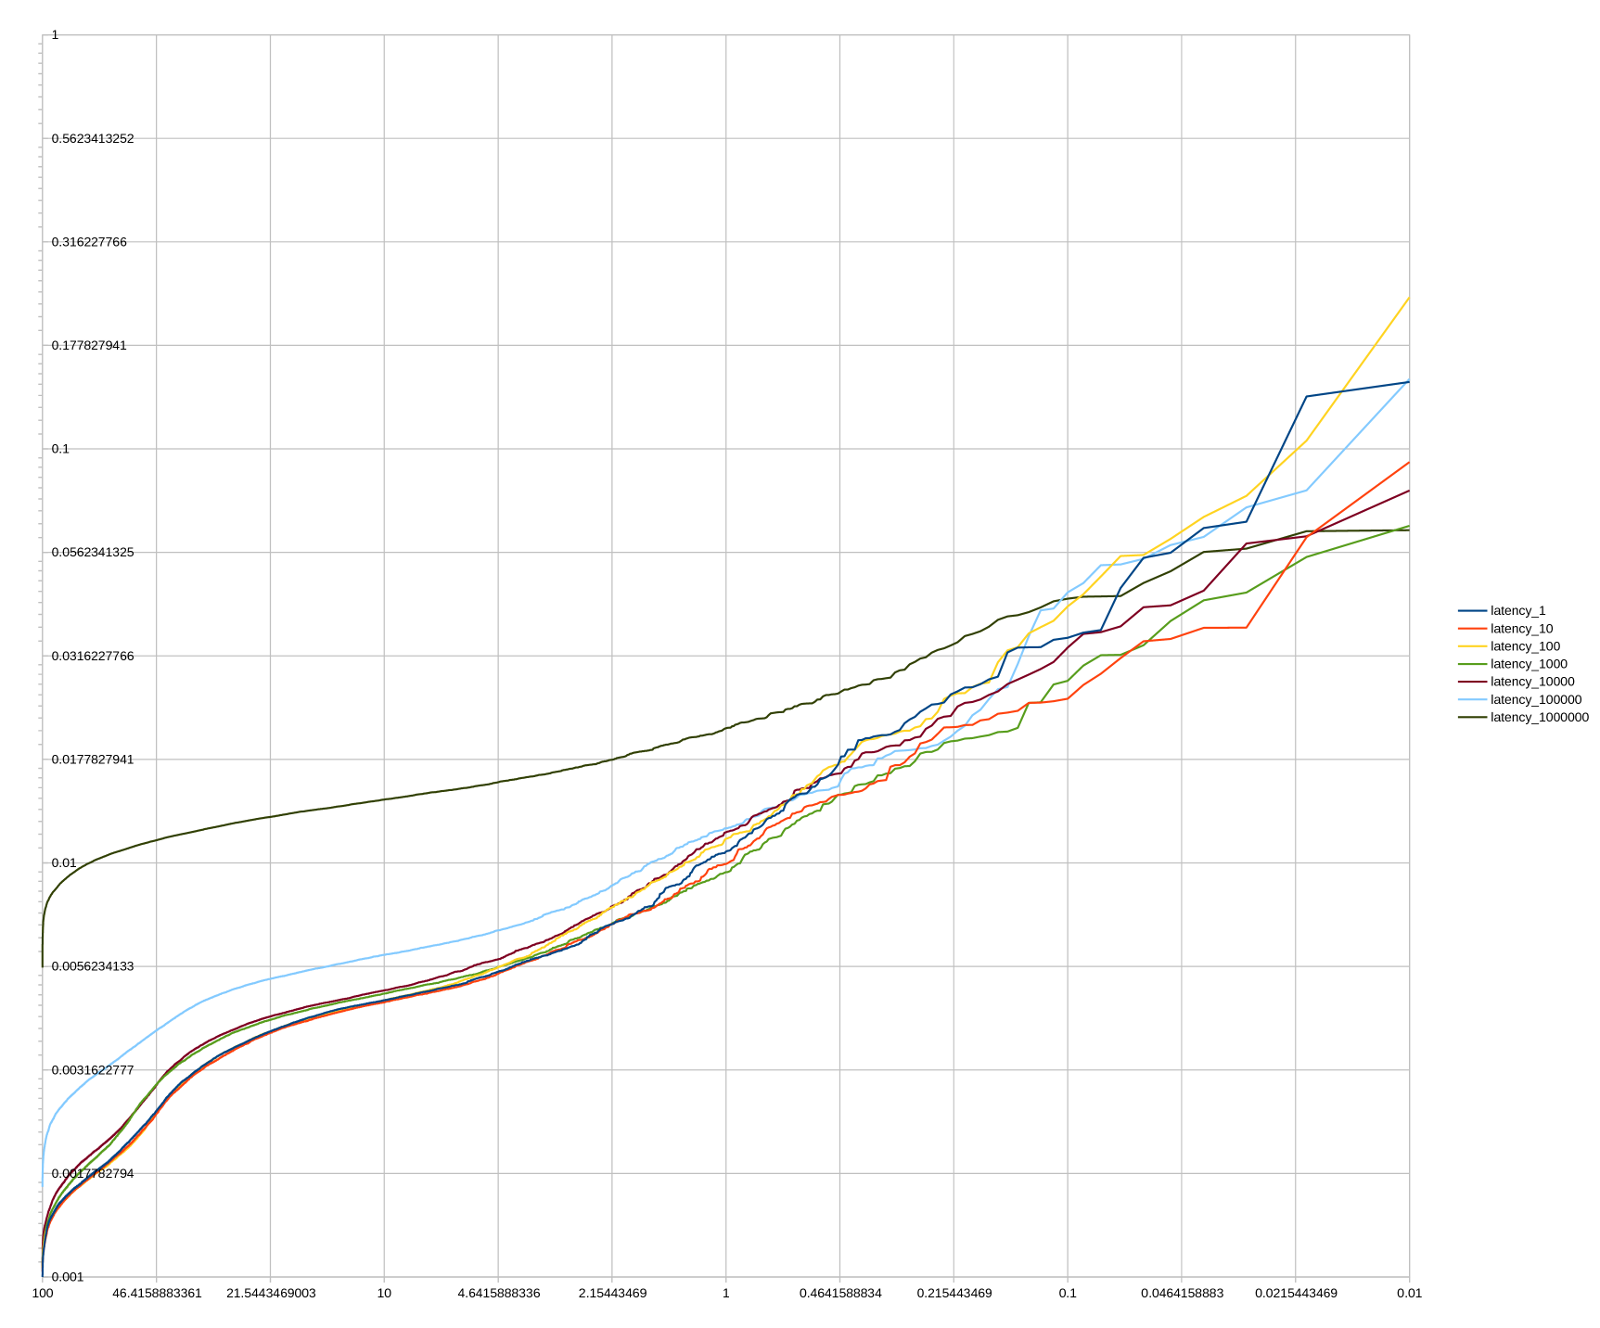
A thread pool and ten thousand API calls later, we had some data!

We got a few things out of this data right away. First of all, latency is in the 1-4ms range for most requests, and nearly always below 10ms. Second, for all except very large values, the size of the value doesn’t make a big difference in latency; even for very large values the difference is less than the factor of difference in value sizes.
But adding as many as a hundred serial 1-4ms fetches to each request wouldn’t be an acceptable latency cost. We did another series of tests and found that the response time for a single multi-get was similar to that of a single get. So in principle, we could rewrite all our code fetch entities in bulk, but that would be difficult and time-consuming to do across our entire codebase, and we didn’t know how effective it would be.
Simulating Memcached latency
Luckily, we had another pile of data at our disposal. For a small percentage of our requests, we set up logging to record which content items were accessed in the request. We initial used this to get simple aggregates: data on how many items were accessed in a particular request, for example. But along with the Memcached profiling data, we could do more: we could simulate how much slower a request would be if it had to make a particular number of Memcached hits.
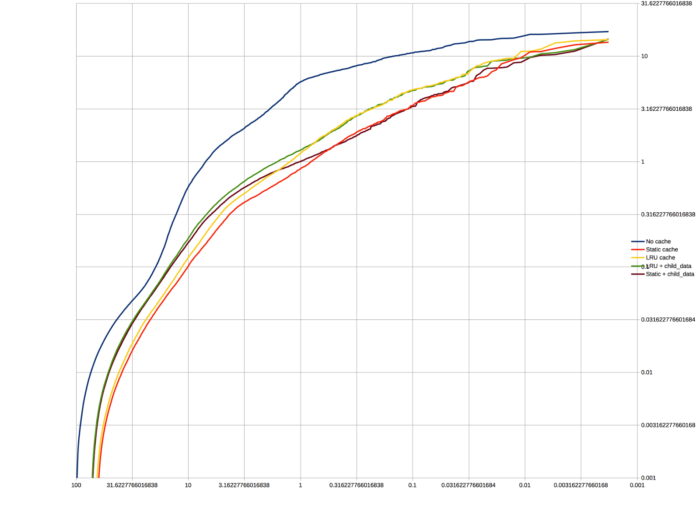
We started by assuming that every content item accessed was a Memcached fetch (the first time in the request). This was, as expected, too slow: over 10% of requests got at least 50% slower. We could hand-optimize a few problematic routes, but not all of them, so we needed a more general strategy. One natural option was to cache some data in-memory on each instance.
Since we had this data, we could simulate particular strategies for caching some content items in memory. We simulated both an LRU cache and choosing in advance a fixed set of items to cache, with several sizes of each. The latter strategy did significantly better than the LRU cache. This remained true even if we used the chronologically first half of the data to decide which items to cache, and measured against the second half, which we took as validation that we could actually choose a fairly accurate set in practice.

However, our results still weren’t quite as good as we wanted; even excluding a few pages we figured could be manually optimized, we were still adding 25% or more to 5% of requests. But we still hadn’t made use of the multi-gets we profiled. First we simulated immediately pulling all children of a topic into cache with a single multi-get for the duration of the request whenever we requested the topic, which we knew would be fairly easy to do. This wasn’t enough, but after several variations on it, we found a strategy that did: if, whenever we loaded a topic page, we pulled in all descendants of that topic (again with a single multi-get), down to some depth, that helped a lot. While it would require code changes, we thought they should be simple enough to be manageable, with nowhere near as many unknowns as “now fix up all problematic code paths”.
Doing it for real
Since then, we’ve implemented the system for real, which I’ll talk about in our next blog post! Not everything worked out as planned, of course. But to build this system out in reality took months, and testing out different caching strategies in production would have days or weeks of turnaround time, whereas in our simulations we could test out a new strategy in just a few minutes. It required some guessing about our codebase — knowing that “on topic pages, pull in every descendant of the topic at the start” was something we could implement, while, say, “pull in every item we need to render the page at once” definitely wasn’t. Of course, a lot of things we didn’t know, but we felt much more confident moving forward with actually implementing a months-long engineering effort with some assurance that the plan has some chance of working. And now we know, a lot more precisely, just what performance we can expect from App Engine Memcached.
Appendix: App Engine Memcached latency data
If you also use App Engine’s dedicated Memcached service, you may find the below data useful. Note that each sample was taken over the course of an hour or so, so it doesn’t account for rare events like memcache outages or more generally capture latency over time. That’s also a potential source of difference between the two tables; they were measured at different times.
Fetch latency by size
| %ile | 1B | 10B | 100B | 1KB | 10KB | 100KB | 1MB |
|---|---|---|---|---|---|---|---|
| 5 | 1.38 | 1.35 | 1.36 | 1.41 | 1.47 | 2.33 | 8.29 |
| 25 | 1.72 | 1.70 | 1.70 | 1.84 | 1.92 | 2.94 | 9.88 |
| 50 | 2.34 | 2.29 | 2.28 | 2.71 | 2.69 | 3.77 | 11.16 |
| 75 | 3.71 | 3.67 | 3.72 | 4.01 | 4.09 | 5.08 | 12.65 |
| 90 | 4.66 | 4.60 | 4.66 | 4.83 | 4.92 | 6.00 | 14.22 |
| 95 | 5.33 | 5.27 | 5.45 | 5.50 | 5.76 | 6.74 | 15.46 |
| 99 | 10.56 | 9.93 | 11.35 | 9.47 | 11.83 | 12.11 | 21.09 |
| 99.9 | 34.59 | 24.57 | 38.44 | 26.97 | 30.57 | 41.15 | 42.84 |
Multi-get latency
| %ile | 1 key | 3 keys | 5 keys | 10 keys | 100 keys |
|---|---|---|---|---|---|
| 50 | 3.06 | 3.87 | 4.00 | 3.70 | 8.29 |
| 75 | 4.30 | 4.66 | 4.77 | 5.02 | 9.94 |
| 90 | 5.17 | 5.46 | 5.61 | 6.30 | 11.88 |
| 95 | 6.01 | 6.60 | 6.77 | 7.64 | 14.12 |
| 99 | 17.22 | 17.64 | 25.23 | 23.01 | 32.20 |
| 99.9 | 92.18 | 234.90 | 225.22 | 70.10 | 108.81 |